
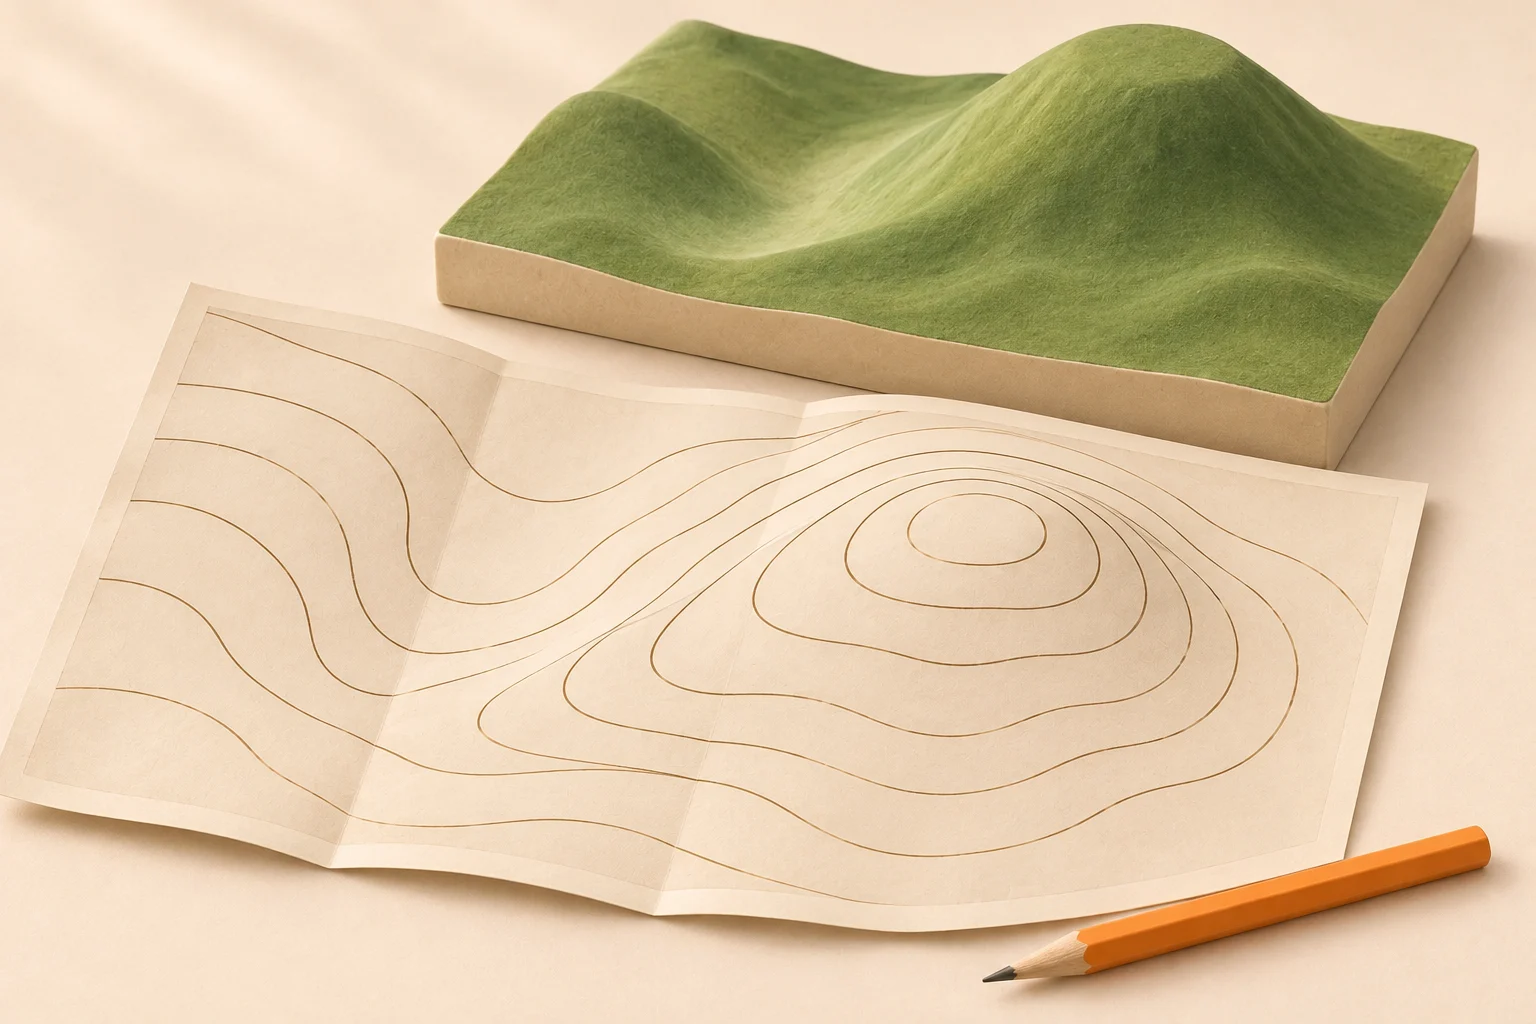
How to read contour lines on a map: four steps
Start with a small patch around a hill or stream. Trying to picture an entire mountain range at once makes the lines harder to follow. Work in this order:
Check the map margin. Find the contour interval and whether elevations use feet or meters. On a digital map, open the legend or map-layer information.
Find a labeled line. Trace it until you are sure which line the number belongs to. Look for another label to establish uphill and downhill.
Read the spacing and bends. Closely packed lines show steeper ground. The shapes help distinguish a valley from a ridge.
Trace your intended trail. Notice where it climbs, descends or crosses a steep band. Compare the map with current trail information before committing to the route.
This lesson focuses on the land surface. For map scale, colors and other symbols, use our full guide to reading a topographic map.
What are contour lines?
Contour lines connect points at the same elevation. Imagine a perfectly level ribbon wrapped around a hillside: its path would follow one contour. The next ribbon higher up would trace a different line.
On a topographic map, elevation is measured relative to the map’s stated vertical reference, usually a sea-level-based datum. A label of 1,000 feet describes height relative to that reference. It does not mean you have climbed that far from the trailhead.
The USGS symbol guide explains how contours turn the land’s shape into a flat map. Brown is the usual land-contour color on USGS maps. Other publishers and special surfaces may use different colors, so check the legend.
A contour is an imaginary line. You will not find it painted on the ground. Following the same elevation across a hillside may still involve rough footing, gullies or obstacles that the map cannot show.
Find the contour interval before counting
The contour interval is the vertical difference between neighboring regular contours. It is usually printed in the map margin. A 40-foot interval means the regular lines step through heights such as 1,000, 1,040 and 1,080 feet.
The vertical interval stays the same within that mapped area unless the map states otherwise. The horizontal spacing changes with the terrain. Two lines can be far apart on paper and still represent exactly the same vertical step as two lines that nearly touch.
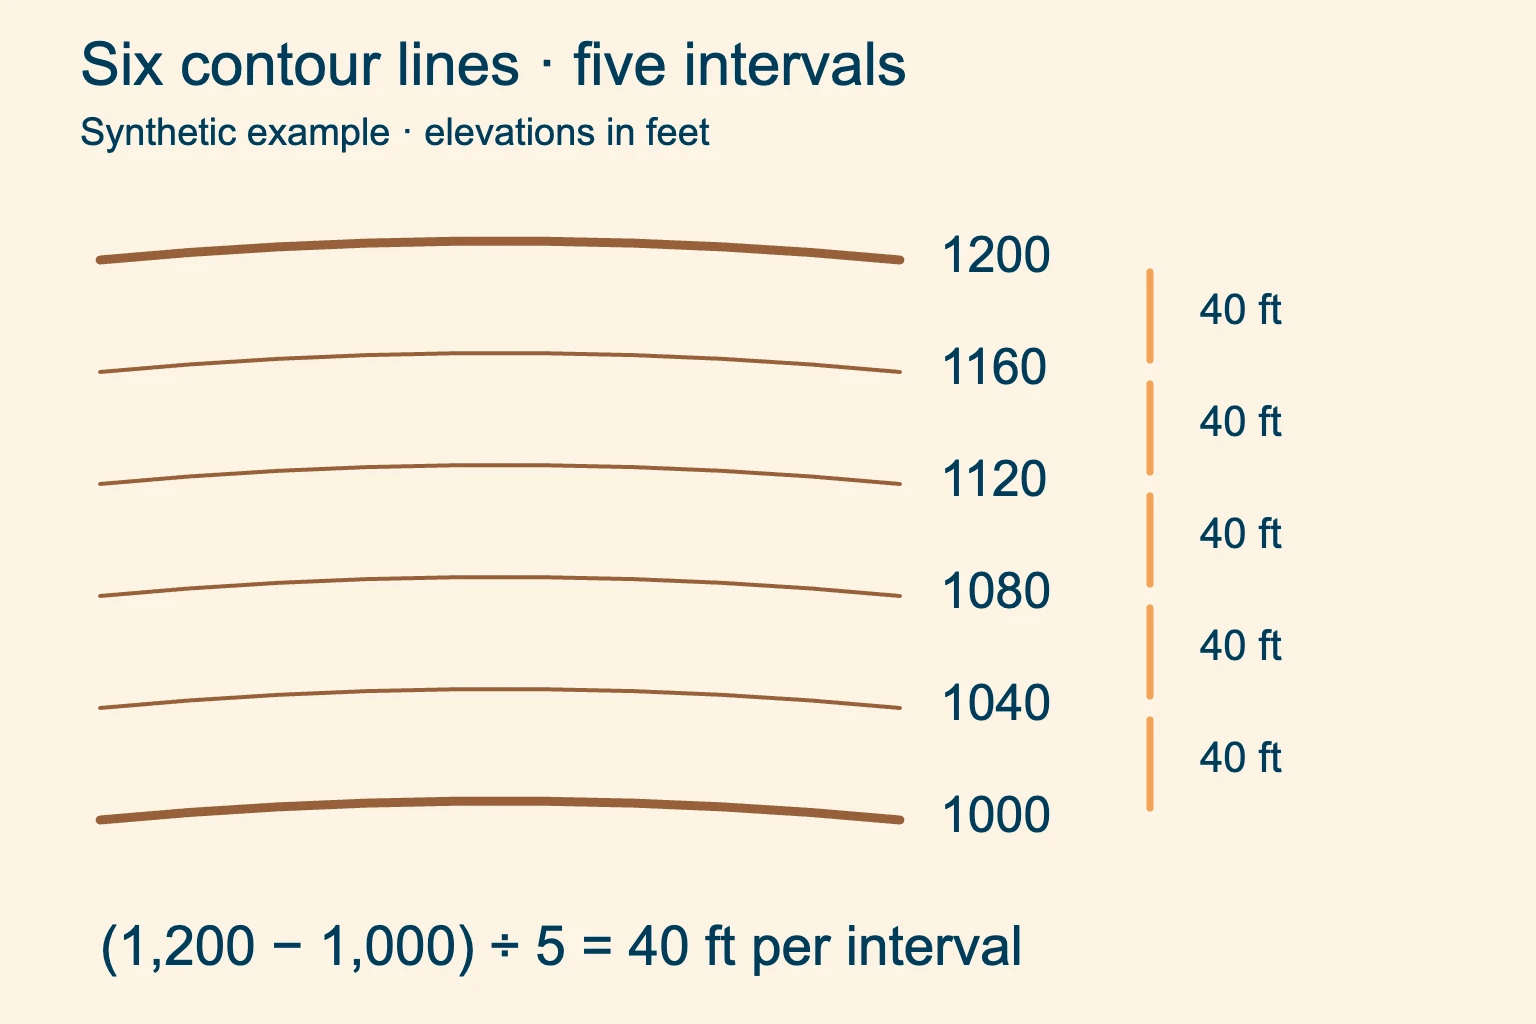
Start at a known height. The lower labeled line is the starting value. Do not count it as the first upward step.
Count each gap once. Four thin contours between two bold lines create five regular intervals.
How to calculate the contour interval
If the margin is missing, find two labeled contours and trace a path between them that goes steadily uphill or downhill. Count the regular gaps. Then use:
Contour interval = elevation difference ÷ number of regular intervals.
For the diagram, subtract the lower label from the upper one. The difference is 200 feet, divided across five gaps, so each gap represents 40 feet. Dividing by the six visible lines would give the wrong result.
Choose another labeled pair to check your answer. This method becomes unreliable if you miss a tightly packed line, cross a valley and climb out again, or accidentally count a supplementary contour as a full step. If the calculation does not agree with the legend, investigate before using it.
Feet, meters and map scale
There is no single interval for every hiking map. USGS notes that flat areas may use 10 feet or less, while mountainous maps may use 100 feet or more. A metric map might use 10 or 20 meters. Read the actual value.
Scale describes horizontal distance; the interval describes vertical change. Enlarging a paper map on a copier spreads out its lines without changing the elevations. Likewise, a zoomed screen may look less crowded even when you are viewing the same slope.
Read an index contour and the lines between it
An index contour is a heavier line with an elevation label. On standard USGS-style maps it is typically every fifth regular contour, with four thinner intermediate contours between successive index lines. The publisher’s legend takes precedence over this pattern.
To assign a height to an unlabeled intermediate line, start at an index contour and add one interval for each step uphill. Subtract for steps downhill. With a 20-meter interval, the second regular line above 500 meters is 540 meters: 500 + 20 + 20.
A dashed supplementary contour shows extra relief between regular lines, often at half the regular interval. It does not create a new full interval. Check its meaning in the legend before including it in an elevation calculation.
Follow a line through its label gap or around a map symbol carefully. A nearby trail, road or grid line can look like a continuation. Contour labels give elevations; the coordinates around the map border serve a different purpose.
Contour lines close together mean a steeper slope
Compare spacing where the scale and regular interval are the same. Close contours pack the same rise into less horizontal distance. Wider spacing spreads that rise over more ground. Evenly spaced contours indicate a roughly uniform slope.
Measure spacing across the slope, roughly at right angles to the contours. A diagonal trail takes a longer route through the same band of elevation. This is why switchbacks can make a steep hillside manageable without changing the hillside itself.
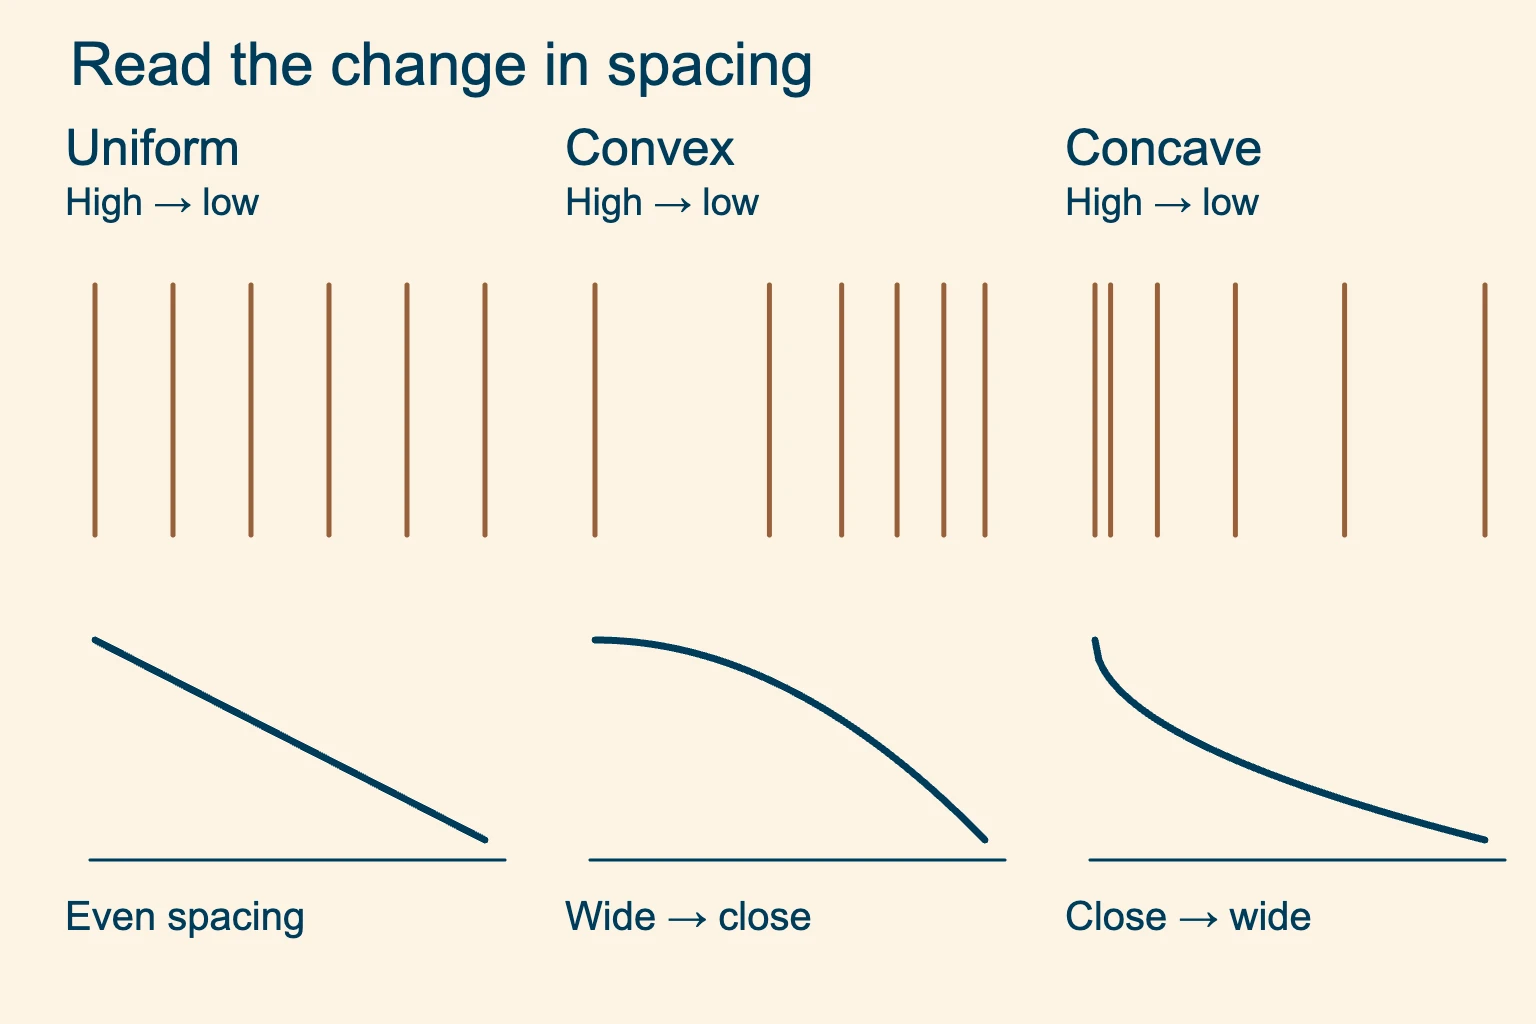
Convex slope. Gentler near the top, steeper lower down. The spacing narrows as you descend.
Concave slope. Steeper near the top, gentler near the bottom. The spacing widens as you descend.
Estimate slope as a percentage
Use the map scale to measure horizontal distance. Divide the elevation change by that distance in the same units, then multiply by 100. A rise of 200 feet over 1,000 horizontal feet gives a 20% grade.
Percent grade is not degrees. That example is about 11.3°, using the arctangent of 0.2. It is also an average across the measured section; a short steeper step may be hidden within it.
A contour map cannot confirm a safe passage. Very tight lines can indicate a cliff or a steep slope. Small drops, loose ground and obstacles may be omitted at the map’s resolution. Check cliff symbols, current route descriptions and the ground ahead. A gentler-looking gap is not proof that an off-trail route is passable.
Valleys and ridges: read which way the bends point
Both features can produce U-shaped or V-shaped contours. The bend alone is not enough. Read the elevation labels to find high ground, then inspect the neighboring contours.
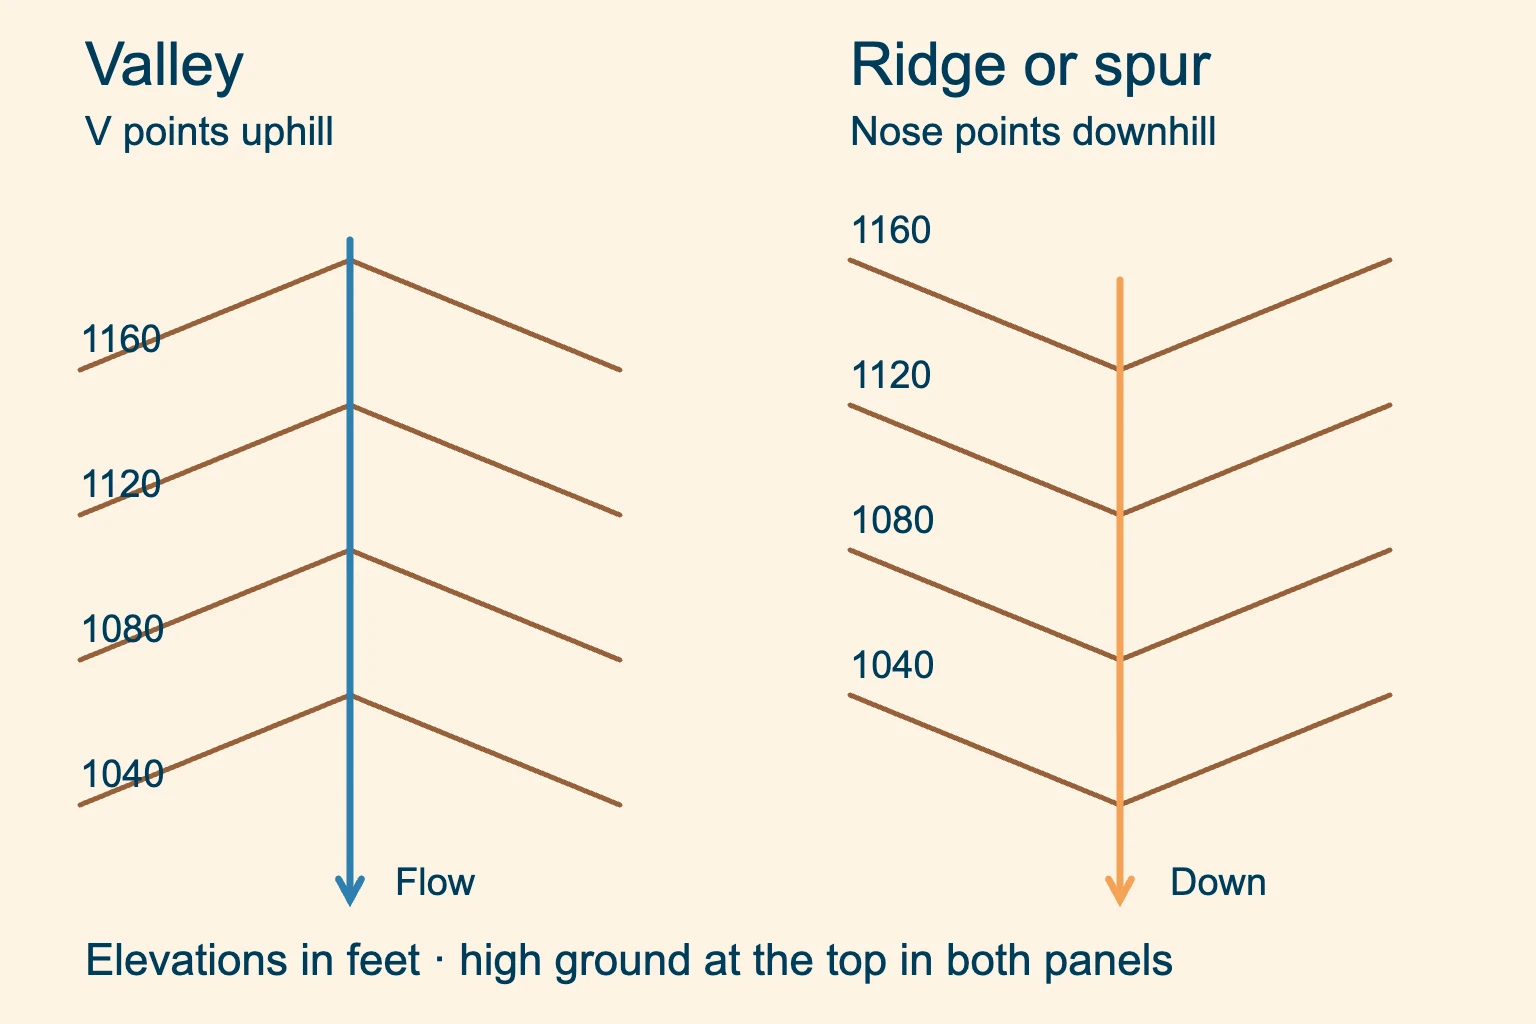
Valley or draw. The V points uphill. A stream in the valley flows downhill, away from the V tips.
Ridge or spur. The contour nose points downhill. The crest has lower ground on either side.
A valley is a low corridor between higher sides. A draw is a smaller drainage hollow. Neither has to contain a visible stream on the day you visit. A ridge is a line of higher ground; a spur is a branch extending from it.
The US Army map-reading manual, chapter 10, illustrates these related shapes. Trace several contours across the feature instead of guessing from one sharp bend. Broad valleys may make rounded U shapes rather than tidy letter Vs.
When checking your location, look for a combination: a valley bend beside a spur, a trail crossing and the next hill. One matching shape is weak evidence. Our compass guide explains how to add direction to that terrain check.
Hills, saddles and depression contour lines
Closed loops with elevations increasing inward describe a hill. The summit lies inside the highest loop. Unless a spot elevation marks it, the exact summit height remains unknown.
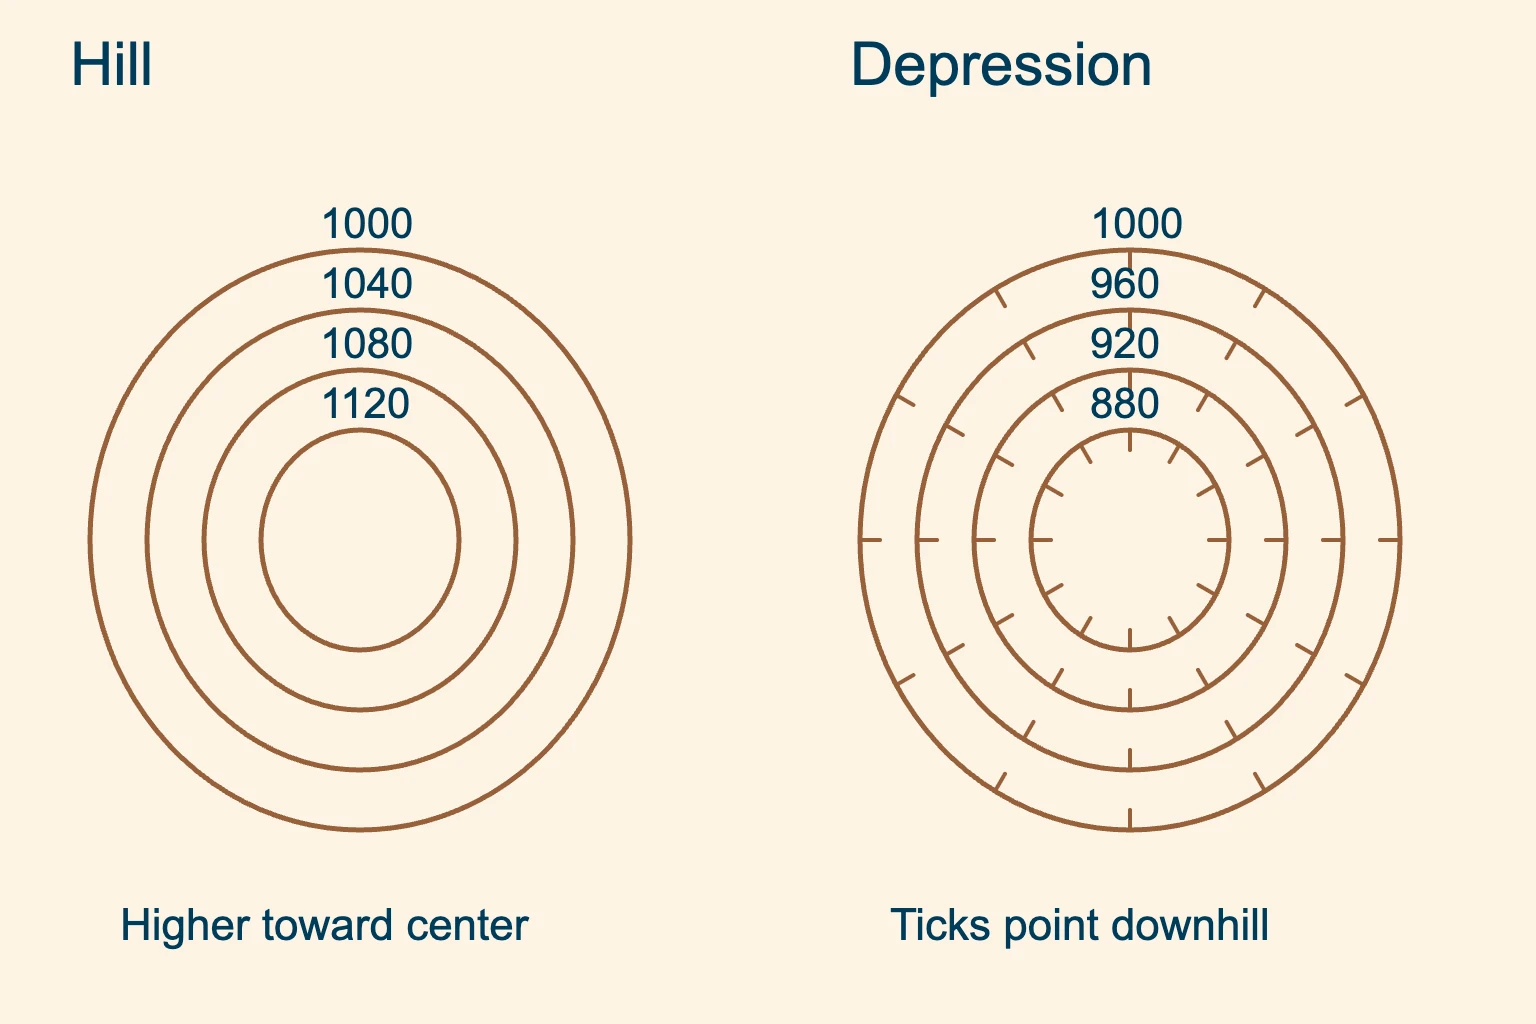
Hill. The center is higher than the surrounding contours. Read the increasing labels inward to find the high ground.
Depression. Short hachure ticks point toward lower ground. Do not read every closed loop as a summit.
For an ordinary hill with a highest regular contour of 1,120 feet and a 40-foot interval, the summit is above 1,120 and below the next expected line at 1,160 feet. A midpoint is only an estimate.
Inside a depression, follow the printed labels rather than continuing an uphill count into the hollow. A cliff symbol may also have downslope ticks, so use the complete symbol and its setting.
Recognize a saddle between two tops
A saddle is a lower area between two higher points. Across one direction the ground rises toward the tops; across the other it falls away. The contours often pinch into an hourglass around the low crossing, though the pattern can be uneven.
A pass through a saddle can still have a very steep approach. Inspect both sides and follow the mapped trail. The saddle’s shape alone says nothing about access rights or present trail conditions.
Calculate elevation gain along the route
Start and finish elevations tell you the net change. Total ascent adds every uphill section, including climbs after a descent. Use the contours to break the route at its high and low points.
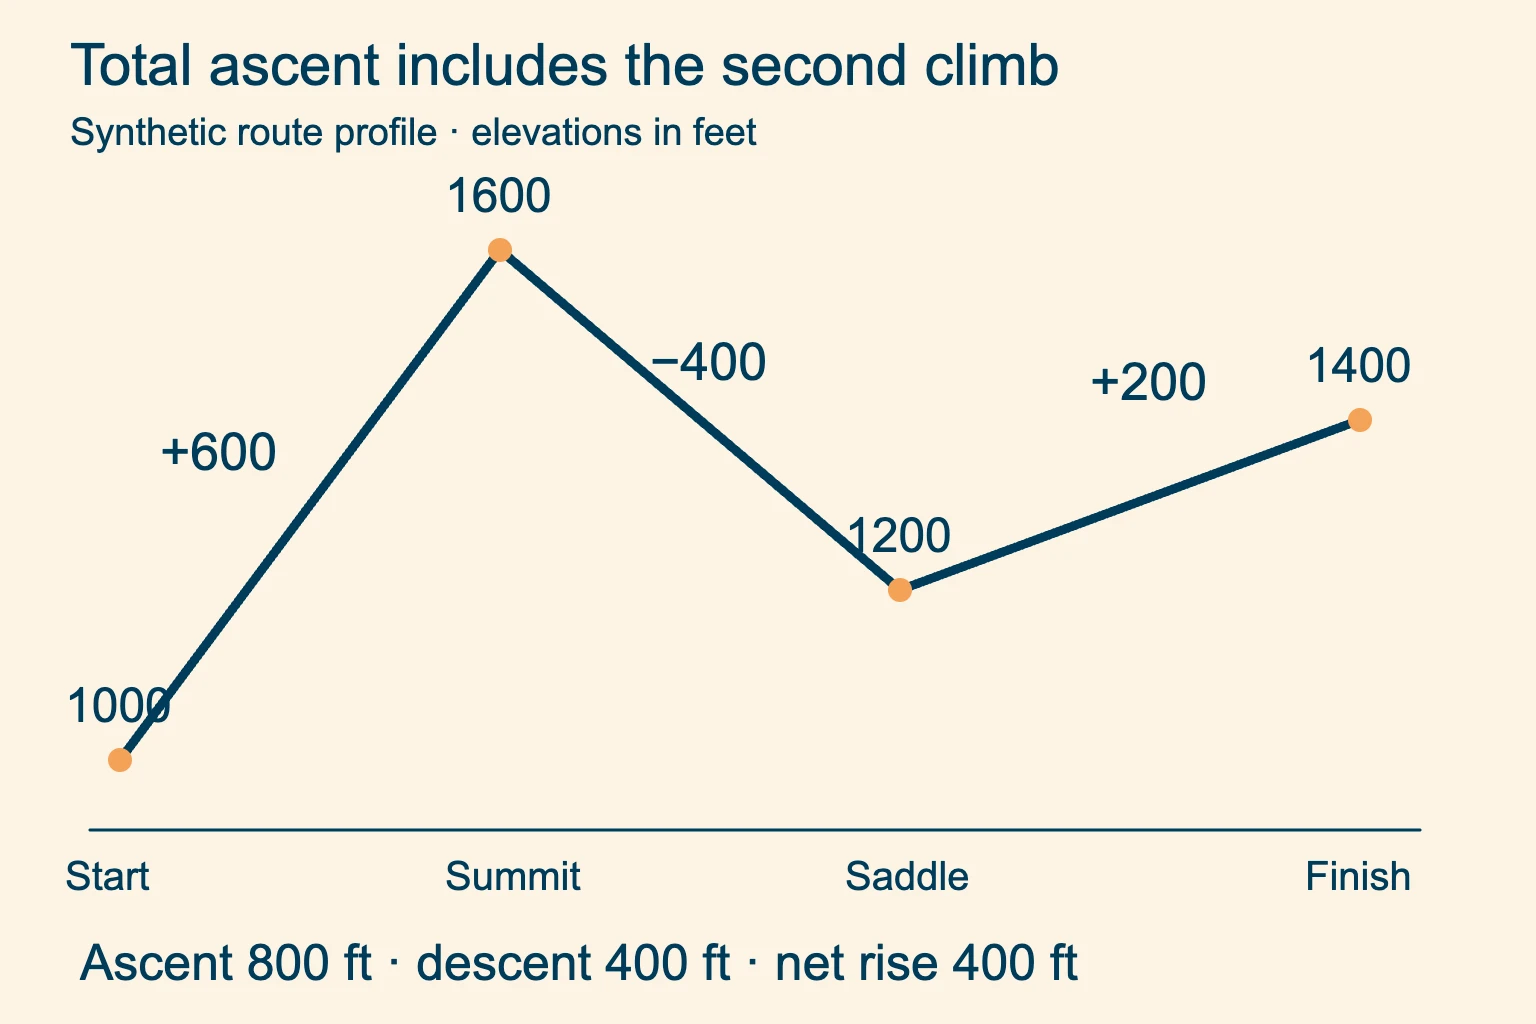
Add the uphill sections. The first climb gains 600 feet and the second gains 200 feet. Together they add up to 800 feet.
Keep descent separate. The middle section loses 400 feet. The endpoint is 400 feet higher than the start.
A trail that crosses the same elevation several times may be going up and down. Count each section in its actual direction. Conversely, a trail that runs along a contour can cover a long distance with little change in height.
Paper estimates miss rises and dips smaller than the interval. Digital profiles depend on the elevation data and processing used. Treat either as a planning estimate and check the route description for steep sections that an average conceals.
Five useful rules of contour lines
- A regular contour joins equal elevations. Its number describes height relative to the map’s vertical reference.
- Find the interval and units before counting. Supplementary lines need separate interpretation.
- On ordinary land-surface maps, contours of different elevations do not cross or branch. They can crowd together or merge in cliff representations.
- Compare spacing at the same scale and interval. Narrow spacing means a steeper slope.
- Confirm shapes with elevation labels. Valley Vs point uphill; ridge noses point downhill.
Use the rules of contour lines as a set. If two apparent lines cross, check whether one is a stream, trail or grid line before deciding the map is wrong.
Contour lines practice: check your reading
Practice reading contours with these invented values before opening the answers. Use the interval diagram above for the first question, then work through the other two on paper.
Six lines run from 1,000 to 1,200 feet. What is the interval?
Show answer
There are five gaps. Divide the 200-foot elevation difference by five: the interval is 40 feet. Count spaces, starting after the lower labeled line.
A valley’s V tips point east. Which way does its stream flow?
Show answer
Toward the west through that mapped bend, away from the V tips and toward lower ground. Trace the channel and labels to check the local direction; the stream may turn farther downstream.
You climb 300 feet, descend 100, then climb 150. What is the total ascent?
Show answer
Total ascent is 450 feet: add the two climbs. Net elevation change is 350 feet after subtracting the descent.
Common contour-reading questions
How do you know whether contour lines go up or down?
Trace the line to an elevation label and compare it with another labeled line. Moving toward larger numbers takes you uphill. Check surrounding contours and depression ticks before assuming a closed loop is a hill.
What do the numbers on contour lines indicate?
They give the elevation of every point on that line relative to the map’s vertical reference. Check the legend for feet or meters. They are not the total climb from your starting point.
Can contour lines cross each other?
Contours at different elevations do not cross on an ordinary land-surface topographic map. On very steep cliffs they may touch or merge at the printed resolution. A stream or trail crossing a contour is a different kind of line.
How to read contour lines on a phone?
Check the selected map layer’s legend, elevation units and visible interval. As MapTiler explains for its maps, displayed intervals can change as you zoom. Recheck the labels after changing zoom, and compare contour spacing only at the same zoom, displayed interval and layer. Download the needed map for offline use before leaving coverage.
Does a wide gap between contours mean flat ground?
It indicates a gentler average slope than tightly spaced contours at the same scale and interval. Small gullies or drops may fit inside that elevation band. The gap does not prove the ground is level or easy to walk across.
Put the contours back into the whole map. Add distance, symbols and direction before using your terrain reading to plan a hike.