
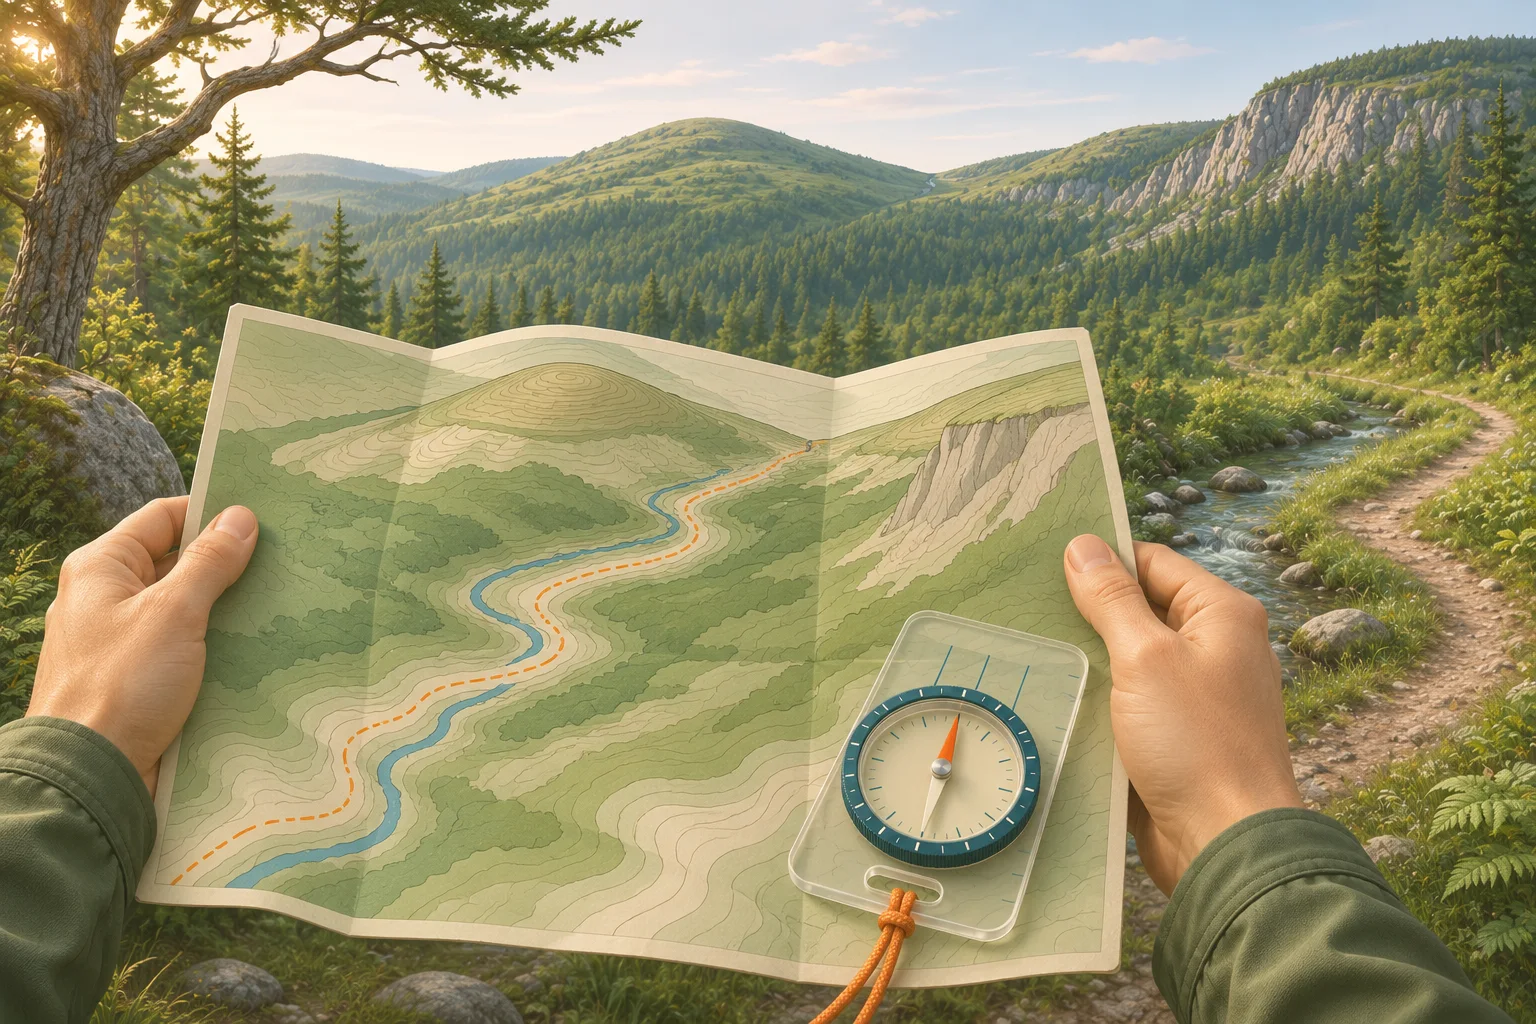
How to read a topographic map, step by step
A topographic map, or topo map, shows the shape of the land with contour lines. A contour joins points of equal elevation (USGS), and the rest is in the margin of the sheet. The best way to learn: sit down at home with a sheet of a place you already know, and read the margin first.
Check the margin first. Find the scale, the contour interval (“Contour interval 40 feet”), the north arrows with magnetic declination, and the date the map was made or revised. Trails and roads change; contours rarely do.
Read the scale. On a USGS 7.5-minute quad the scale is 1:24,000: one inch on the map is 2,000 feet on the ground.
Find an index contour. Every fifth contour is drawn thicker and has its elevation printed on it. Count the thin lines up or down from there.
Look at the spacing. Lines close together mean a steep slope. Lines far apart, or none at all, mean gentle or flat ground.
Read the shapes. Closed rings are hills. V or U bends that point uphill are valleys and draws; bends that point downhill are ridges and spurs.
Turn the map to match the land. Line the map up with north, then match two or three features you can see. Now every line on the paper has a place in front of you.
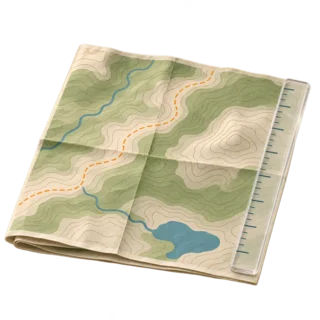
Paper topo map
A USGS quad, a park map or a Trails Illustrated sheet. Paper does not run out of battery.
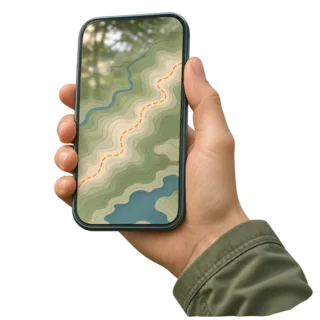
Topo map on a phone
Same contour lines on a screen, plus a dot that shows where you are. Download it before you lose signal.
Topographic map contour lines
Contour lines are brown on a USGS map. The Army land navigation manual, FM 3-25.26, names three kinds. Knowing which one you are looking at keeps you from misreading the elevation by a whole interval.
Index contours
Thick lines, every fifth contour, with the elevation printed along them. Start every reading here.
Intermediate contours
The four thin lines between two index lines. Each one is one contour interval higher or lower.
Supplementary contours
Dashed lines at half the interval, used where the ground is so flat that the regular lines are far apart.
The contour interval is the height difference between two neighboring lines. It is printed in the margin and it changes from map to map. USGS notes that a map of flat country may use 10 feet or less, while a map of mountains may use 100 feet or more. Two maps can look equally crowded and show very different slopes, so never compare steepness across sheets without checking the interval.
Rules of contour lines
How to read elevation on a topographic map
To read the elevation of any point, find the nearest index contour, then count the lines between it and your point. FM 3-25.26 gives a clean example: on a map with a 20-meter interval, a point on the second thin line above the 500-meter index line is at 540 meters. Going uphill you add the interval for every line; going downhill you subtract it.
Note the interval and the unit. Feet or meters, both are used. A 40-foot interval and a 20-meter interval are not the same thing.
Start at a numbered line. Find the index contour closest to your point and read its number.
Decide uphill or downhill. Look at the next index number. If it is bigger, you are climbing toward it.
Count and add. Multiply the lines crossed by the interval and add or subtract.
Tops and bottoms. For a hilltop, add half the interval to the last ring. For a depression, subtract half the interval from the lowest contour around the depression.
The map also gives exact heights. A bench mark, shown as an X with “BM” and a number, is a surveyed point. Spot elevations are printed on summits, passes and road junctions. When a number sits right on the top of your hike, use it instead of counting lines.
Points between two lines. The Army rule of thumb has three cases. Less than a quarter of the way to the next line: use the lower line’s height. Between a quarter and three quarters: add half the interval. Beyond three quarters: use the next line’s height. We find that close enough for planning a hike.
Read steepness and spot a cliff
The spacing of contour lines is the slope. Evenly spaced lines mean a uniform slope, steep if they are close and gentle if they are wide. A concave slope has lines bunched at the top and spread at the bottom: the hardest climbing comes last. A convex slope is the reverse, and from its top you cannot see the bottom, which matters when you are picking a way down.
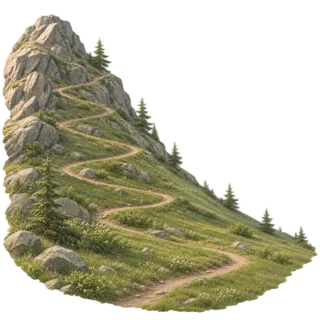
Concave slope
Steep near the top, easy below. Lines close at the top, wide at the bottom.
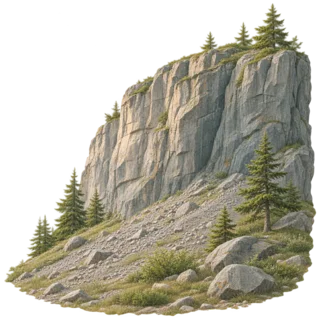
Cliff
Lines so close they touch or merge into one, sometimes with tick marks on the low side. Do not plan a route across it.
To put a number on it, divide the rise by the distance. A trail that climbs 400 feet in a horizontal half mile (2,640 feet) has a grade of about 15%. On a 1:24,000 map that half mile is about 1.3 inches. We treat a steady 15% as hard work with a pack and plan extra time for it.
Topographic map features: hill, saddle, valley, ridge
Contour shapes repeat everywhere, so you learn about ten of them and can read any topo map. FM 3-25.26 lists five major terrain features (hill, saddle, valley, ridge, depression), three minor ones (draw, spur, cliff) and two man-made ones (cut and fill along roads). The figure below shows six of them on one small map.
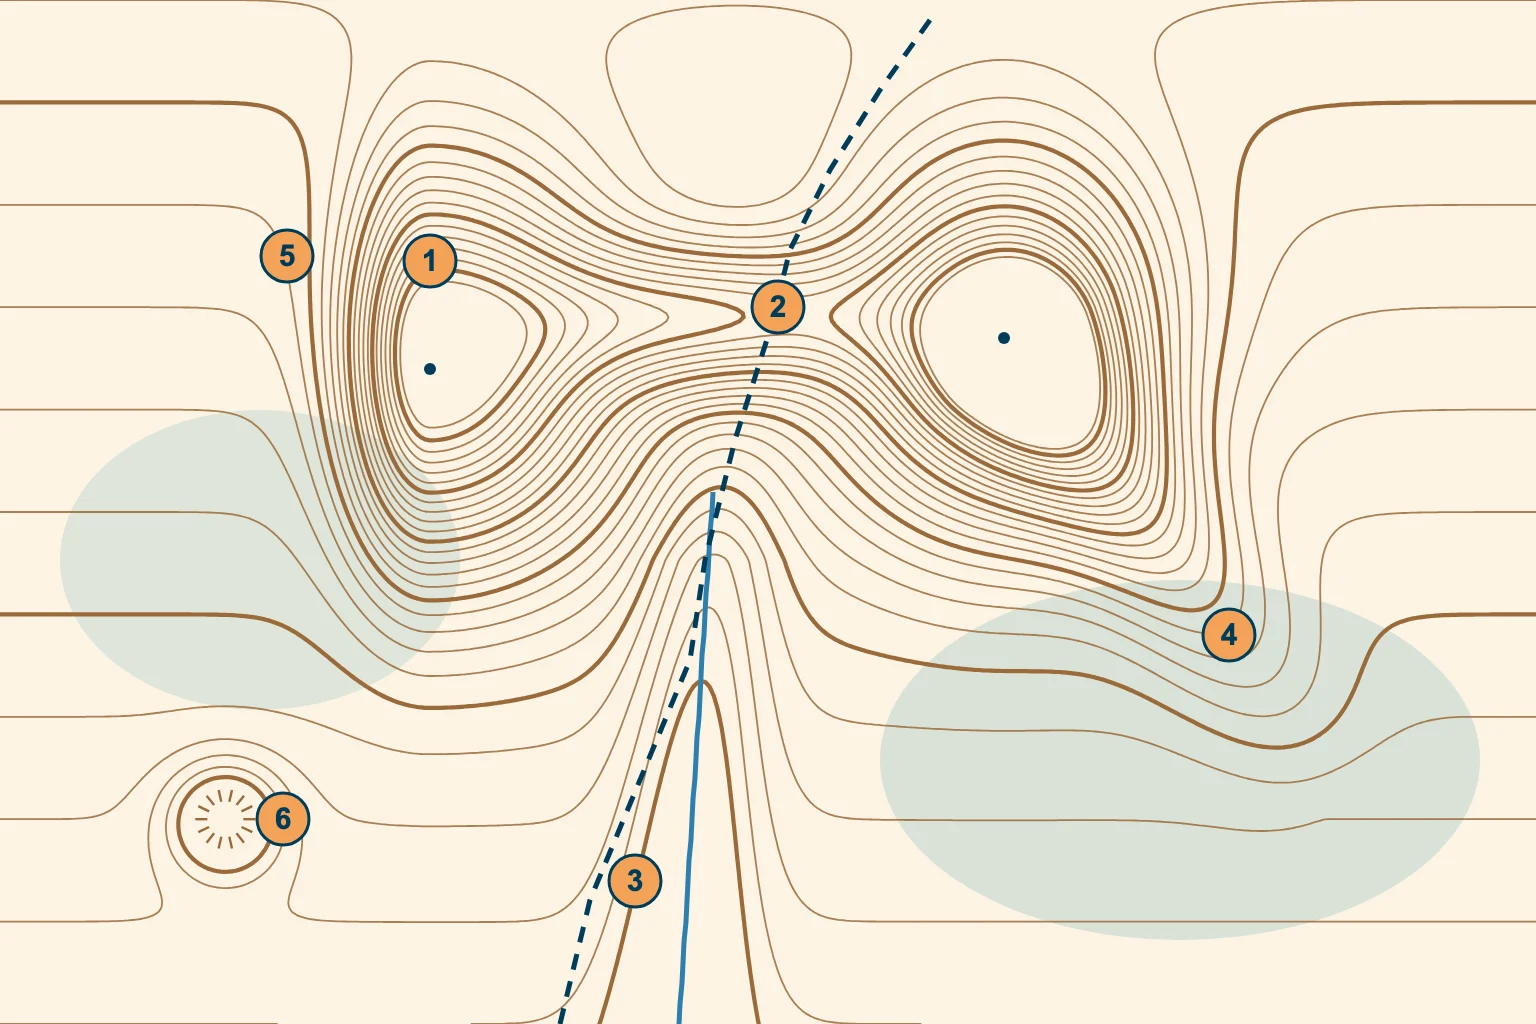
1 Hill. Closed rings, smallest in the middle. The dot marks the summit.
2 Saddle. The low point between two tops; the lines make an hourglass. The trail crosses here.
3 Valley. Lines bend into a U that points north, up the valley; the stream runs south, down it.
4 Spur. Lines bend into a U that points away from the high ground: a ridge running down off the hill.
5 Cliff. Lines crowd together on the west face of the hill.
6 Depression. A closed ring with ticks pointing inward to lower ground.
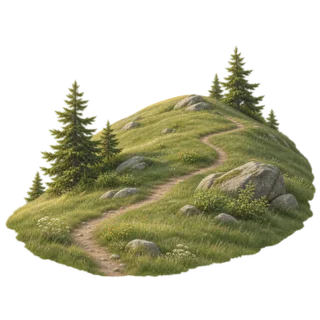
Hill
High ground that falls away in every direction. Concentric closed rings.
On the ground: everything slopes down from you.
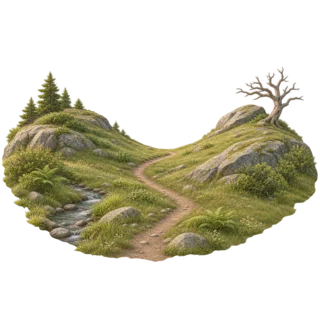
Saddle
A dip between two higher points. An hourglass of contours.
Trails usually cross a ridge at its saddle.
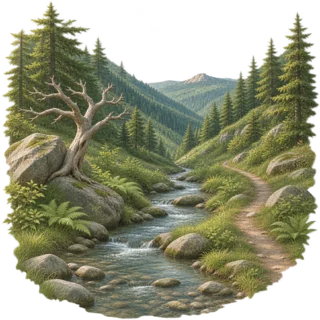
Valley
A long low groove, usually with a stream. U or V lines point upstream.
High ground on three sides, low ground ahead.
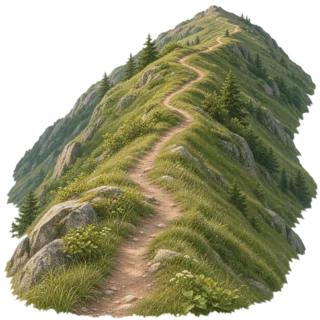
Ridge
A line of high ground. U or V lines point away from the high end.
Low ground on three sides, higher ground in the fourth.
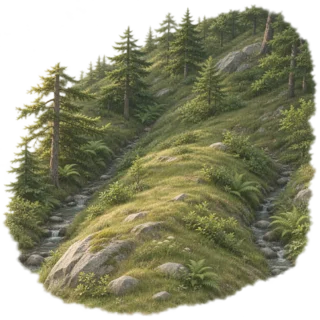
Spur and draw
A spur is a short ridge off a larger slope; a draw is a small, steep valley beside it.
Easy to confuse in fog: check which way the V points.
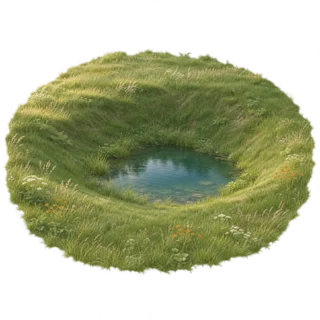
Depression
A sinkhole or hollow. A closed ring with tick marks on its inner side.
Only hollows deeper than one interval are shown.
Read the bends where contour lines cross a stream and you know which way the water flows, which side is uphill, and whether you are following a valley or a ridge.
Topographic map colors and symbols
Colors group the information. This is the USGS scheme; other publishers use something close to it, and every map has a legend that settles any doubt.
Brown
Contour lines and elevation numbers.
Blue
Water: lakes, rivers, streams, springs and marsh. The legend has separate symbols for streams that run all year and for intermittent ones.
Green
Vegetation, such as woodland and scrub.
Black
Trails, roads, railroads, buildings, boundaries and names.
Red
Important roads and the land survey grid. Built-up areas are tinted gray or red.
Purple
The old revision color for changes. USGS no longer uses it, but it survives on many older maps.
Springs, campgrounds, mines, wells and water tanks each have their own point symbol, explained in the legend. Updated US Topo maps show more trails than older editions. Still, a trail on any map is only as current as its date. We check a recent park map before trusting a faint line.
Topographic map scale and distance
A scale of 1:24,000 means one unit on the map equals 24,000 of the same units on the ground. One inch is 24,000 inches, or 2,000 feet, so about 2.6 inches make a mile. A 1:50,000 map, common outside the US, gives 1 cm = 500 m, and 2 cm make a kilometer. The bigger the number after the colon, the less detail you get.
Straight line. Lay a ruler or the edge of a compass baseplate between two points and compare it with the scale bar.
Along the trail. Lay a piece of string or the edge of a sheet of paper along each bend, mark it, then measure it against the bar. Switchbacks add more than they seem.
Add the climb. Count contour lines along the trail to get the total ascent. Naismith’s rule, still a common planning rule: allow one hour per 5 km (3 miles), plus one hour per 600 m (2,000 ft) of climb.
Map distance is flat distance. A map measures horizontally. On a steep trail you walk farther and much slower than the line suggests, so plan time from the distance and the climb together, as Naismith’s rule does.
How to use a topo map for hiking
Reading the map at home is half the job. On the trail the job is to keep the map matched to the land and to know where you are before you need to.
Orient the map. Lay a compass on the map with its edge along a north–south line, then turn map and compass together until the needle points north (allowing for declination). Without a compass, turn the map until a road, ridge or lake lines up with the real one.
Tick off features. Before each leg, say what you expect: “cross a stream, then climb to a saddle with a peak on the left.” Each feature that arrives on time confirms your position.
Use handrails. Streams, ridges and trail junctions that run along your route are easy to follow on paper and on the ground.
Know your catching feature. Pick something you cannot miss beyond your goal, like a road or a river, so you know when you have gone too far.
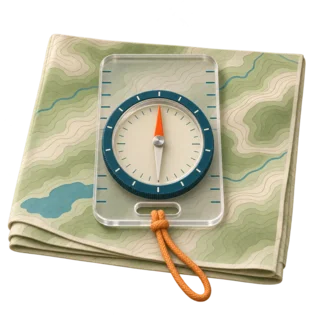
Map and compass together
The compass gives direction; the contour lines tell you whether you are on the right ridge.
Topo map in an app
Most hiking apps show contour lines. Download the area offline and carry a paper copy as a backup.
Where to get topo maps for hiking
USGS US Topo maps, the current 1:24,000 series, are available for free and immediate download as PDF from The National Map Downloader and topoView, which also hosts historical sheets. They print well on a home printer if you print only the part you need. National Geographic Trails Illustrated maps cover many US parks with trails already marked. In an app, choose a layer with contour lines, not a plain street map.
Map and terrain guides
This page is the overview. Each guide below goes deeper into one map skill.
- Magnetic declinationThe angle between true and magnetic north.
- How to read contour linesInterval, index lines and landforms in detail.
- Topographic map symbolsThe legend, line by line.
- Map and compass togetherBearings, triangulation and staying on course.
- GPS for hikingPhone app or handheld.
- GPS and UTM coordinatesRead and give a grid position.
- Find north without a compassSun, stars and shadows.
Topographic map questions
What is the easiest way to learn how to read a topographic map?
Start in the margin: scale, contour interval and north. Then find a thick index contour with a number, count the thin lines up or down to your point, and read the spacing: close lines are steep, wide lines are gentle. Finally read shapes: rings are hills, V’s pointing uphill are valleys.
What do the lines on a topographic map mean?
The brown lines are contour lines. Each one joins points of the same elevation, and the height between two neighboring lines is the contour interval printed in the margin. Every fifth line is thicker and carries its elevation.
What are the 7 rules of contour lines?
1) Every point on a line has the same height. 2) Lines never cross. 3) Every line closes on itself. 4) Close lines mean steep ground. 5) V’s point upstream. 6) The smallest ring is a top. 7) Tick marks show a depression and point downhill.
Which line indicates a cliff?
Contour lines that run very close together, touch or merge into one line. Some maps add tick marks on the low side of a merged cliff line.
How do you read elevation on a topo map?
Find the nearest numbered index contour, count the lines to your point and multiply by the contour interval. Add going uphill, subtract going downhill. For a summit, add half the interval to the last ring, or use the printed spot elevation.
What does 1 to 50000 scale map mean?
One unit on the map equals 50,000 of the same units on the ground: 1 cm on the map is 500 m, so 2 cm is a kilometer. A US 1:24,000 quad shows more detail: 1 inch is 2,000 feet.
How do you measure distance on a topo map?
For a straight line, compare a ruler with the scale bar. For a trail, lay a string along the bends and measure the string. Then add time for the climb, which you get by counting contour lines.
What do the colors on a topographic map mean?
On USGS maps brown is contours, blue is water, green is vegetation, black is trails, roads and buildings, red is major roads and the survey grid, and purple marks old revisions.
What is a USGS topo map?
A topographic map from the U.S. Geological Survey. The current US Topo series uses the 7.5-minute, 1:24,000 quadrangle layout and is a free download.
Can you get topographic maps on Google Maps?
Google Maps has a Terrain layer that shades the relief and, when you zoom in, shows some contour lines. For hiking, a topo map from USGS or a hiking app with contour lines shows trails, streams and contours in far more detail.
Ready to try it? Open a route, look at its contour lines and elevation profile, and guess where the climbs are before you go.